Diagramme der Biogasproduktion

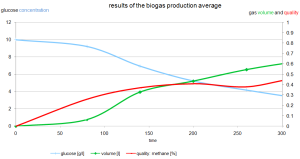
Die Biogasproduktion wurde von 14 internationalen Arbeitsgruppen durchgeführt. Das durchschnittliche Ergebnis, Auswertung und Diskussion der 14 Arbeitsgruppen werden im Diagramm unten dargestellt:

average

Auswertung und Diskussion

Das Diagramm zeigt das durchschnittlich Ergebnis der Biogasproduktion, mit Mais als Substrat während den 5 Stunden der Fermentation.

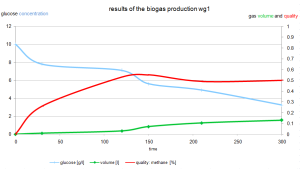
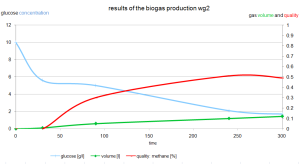
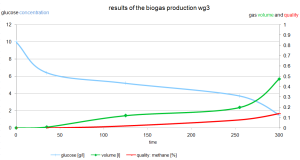
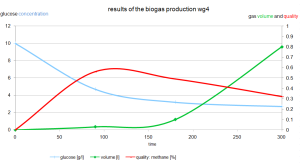
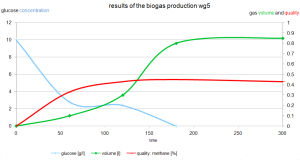
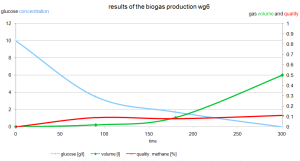
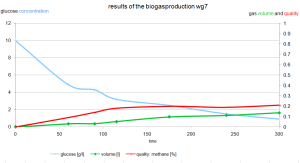
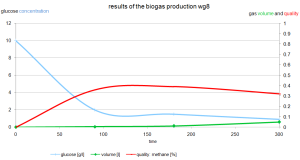
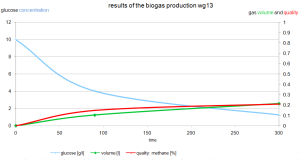
The blue glucose curve starts at 10 g/l, since we added 10 g glucose per litre of substrate at the beginning. The glucose concentration is decreasing continuously because it’s metabolised by the microorganisms as the easiest energy source.

Die blaue Glukosekurve beginnt bei 10 g / l, da wir 10 g Glucose pro Liter Substrat, am Anfang, dazugeben. Die Glucosekonzentration nimmt kontinuierlich ab, weil es durch Mikroorganismen abgebaut wird.

Die grüne Kurve zeigt das gemessene Biogas in Liter.

Die rote Kurve zeigt die Gasqualität von Methan(%) im produzierten Biogas.

Es beginnt immer bei 0, da die Organismen während der Befüllung des Behälters aeroben Bedingungen hatten.

Die Qualität hängt auch von anderen Parametern, wie Temperatur, die bei 50 ° C optimal ist. Der optimale pH-Wert ist bei 7, 1.

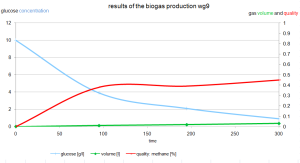
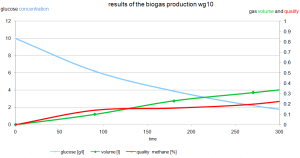
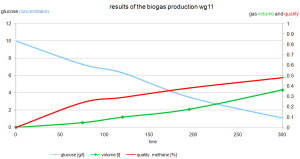
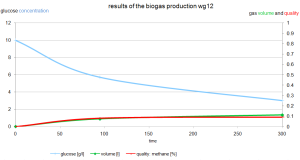
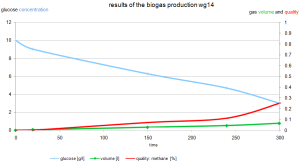
Die Ergebnisse der 14 Arbeitsgruppen sind in den folgenden Diagramme dargestellt:

.wg1wg2wg3wg4wg5wg6wg7wg8wg9wg10wg11wg12wg13wg14

Biogas out of corn scrap

Please click on the links below with the right button of your mouse and then click “Save File”.


Document for students:

corn


Power-Point for teachers:

corn

Biogas out of fruit waste

Please click on the links below with the right button of your mouse and then click “Save File”.


Document for students:

fruitwaste


Power-Point for teachers:

fruit waste

Timetable

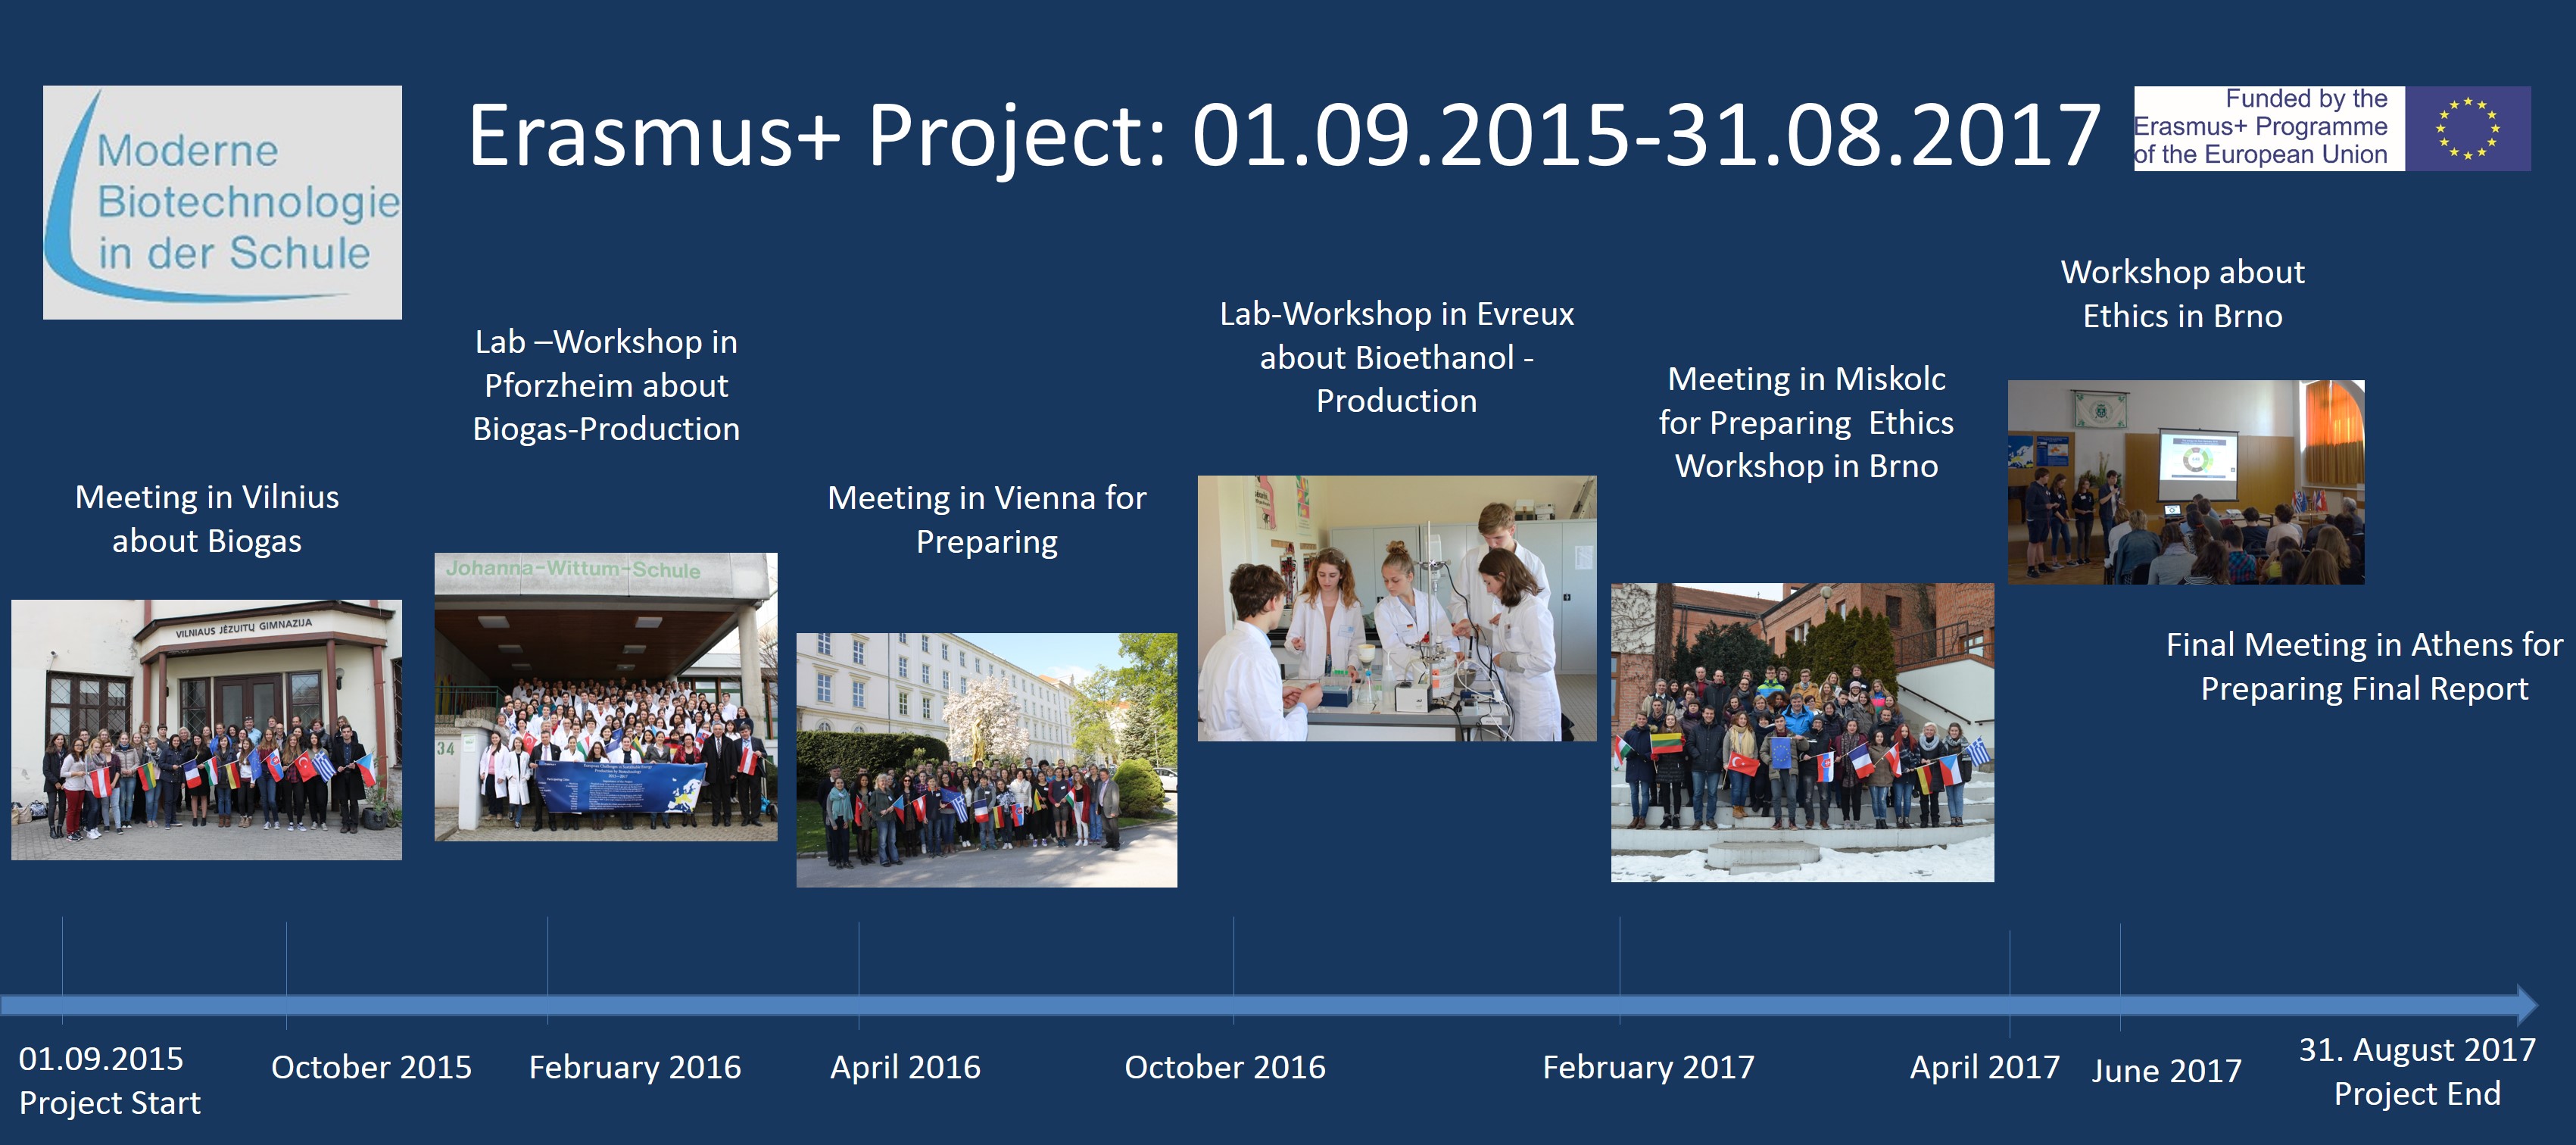
Erasmus+Zeitstrahl

Scheduled Meetings:

1. Teacher-mentor meeting October 2015 in Vilnius
Programme:
 Preparing a teaching unit for the production of biogas
Creation of the English protocols and all languages of the partner schools to the experiments for the lab workshop in Pforzheim with the topic:
Production of biogas by fermentation out of fruit waste and corn scrap estimating volume of produced biogas and its quality via gaschromatography.

more information


2. Teacher-student lab workshop February 2016 in Pforzheim
Programme: Execution and evaluation of the teaching unit for the production of biogas
Execution of the biogas experiments in a lab workshop led by mentors to evaluate the experiment from fruit waste and corn scrap to biogas. (see results)

more information


3. Teacher-mentor meeting April 2016 in Vienna
Programme: Preparing a teaching unit for the production of bioethanol
Preparation of the protocols of the experiments in the working language of English and translations into the languages of the partner schools for the following lab workshop in Evreux with the topic: Production of bioethanol out of waste paper via enzymatic hydrolysis from cellulose to glucose and the anaerobic fermentation from glucose to bioethanol, the purification of bioethanol by distillation and its transformation into electricity in a fuel cell.

more information


4. Teacher-student lab workshop October 2016 in Evreux
Programme: Execution and evaluation of the teaching unit for the production of bioethanol
Execution of the bioethanol experiments in a lab workshop led by student mentors to evaluate the experiment from waste paper to bioethanol via enzymatic hydrolysis from cellulose to glucose and the anaerobic fermentation from glucose to bioethanol, the purification of bioethanol by destillation and its transformation into electricity in a fuel cell. (see results)

more information


5. Teacher-mentor meeting February 2017 in Miskolc
Programme:
Presentations about several energy soures, their advantages and disadvantages which should help the mentors in the following workshop in Brno as a working basis for the discussion about a future energy mix in Europe.

more information


6. Energy workshop with ethical discussion April 2017 in Brno
Programme:
We discussed the advantages and disadvantages of the different energy sources. Therefore we heard  presentations about those energy sources from our mentors. In small international groups we evaluated the possible options of the pros and cons, ethical consequences and ethical values of the different energy sources. The mentors guided us through a rotating system of different work stations. All international groups made the decisions for their own energy mix and created a pie chart to explain their energy mix to the audience. An average pie chart was made out of all the pie charts from every group. Finally we discussed this average pie chart and compared it with the current energy mix from Europe. (see results)

more information


7. Teacher-mentor meeting June 2017 in Athens
Programme:
Preparation of the final report together by 9 teachers and 9 students from abroad and the host team.

more information