
The biogas production was conducted by 14 international workgroups. The average result, evaluation and discussion of the 14 workgroups are shown in the diagram below:
Evaluation and Discussion
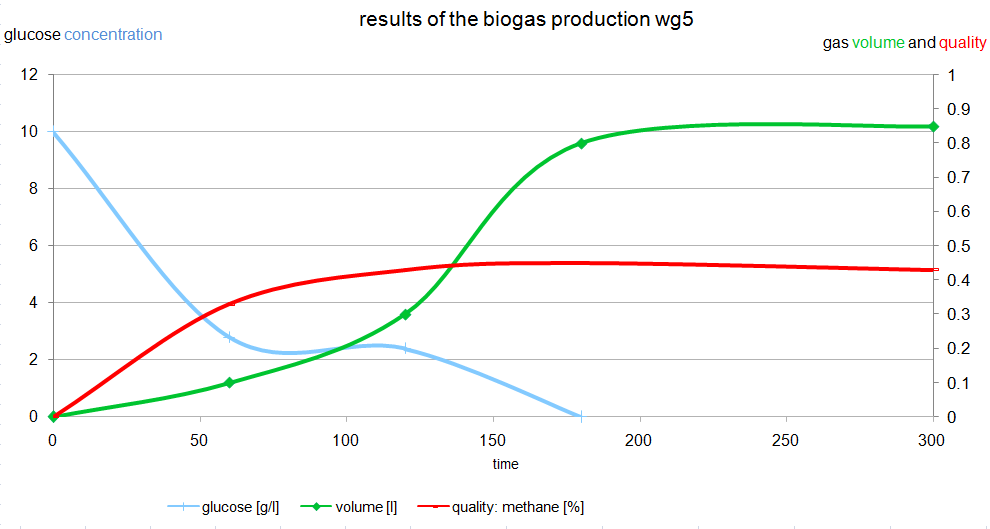
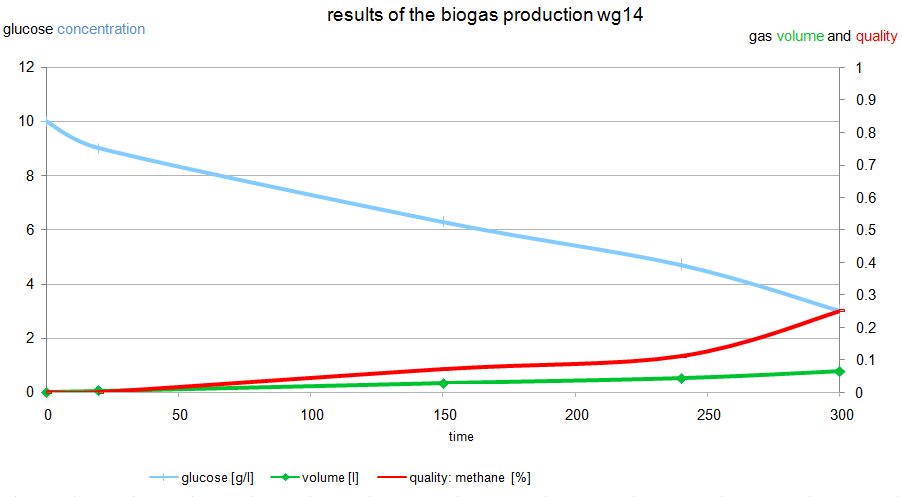
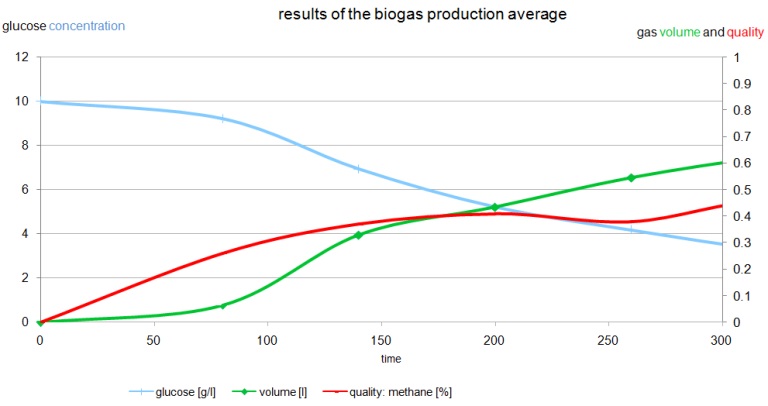
The diagram shows the result of the biogas production in average of 14 work groups with corn as substrate during 5 h of fermentation.
The blue glucose curve starts at 10 g/l, since we added 10 g glucose per litre of substrate at the beginning. The glucose concentration is decreasing continuously because it’s metabolised by the microorganisms as the easiest energy source.
The green curve shows the measured biogas values in litre. After 60 min. the conditions for the different organisms are properly to produce biogas. After 5 h of fermentation the organisms continuously produced 600 ml of biogas.
The red curve shows the gas quality in % of methane in the produced biogas. It always starts at 0 since the organisms had aerobic conditions during filling the vessel. Once there is no more oxygen in the vessel the amount of methane is increasing at anaerobic conditions. The quality also depends on other parameters like temperature which is optimal at 50 °C and the pH value (7, 1 pH).
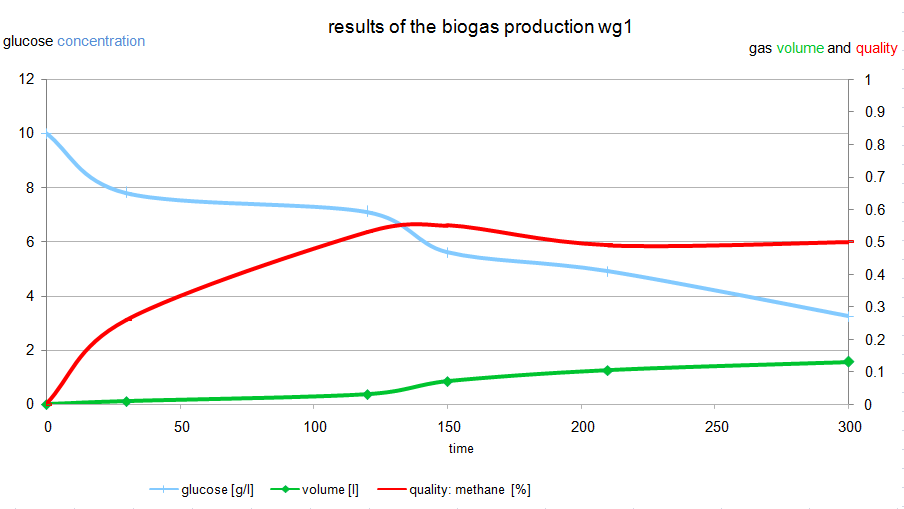
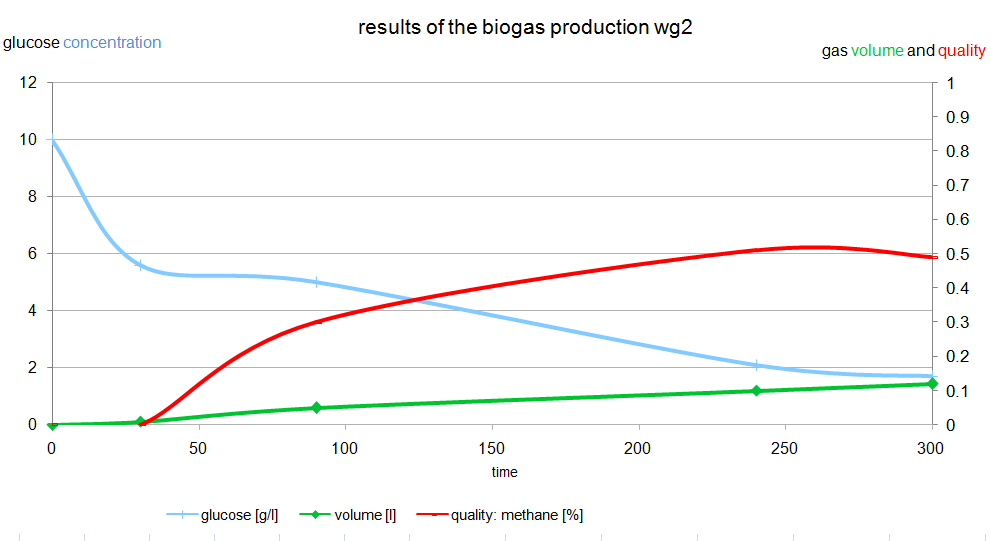
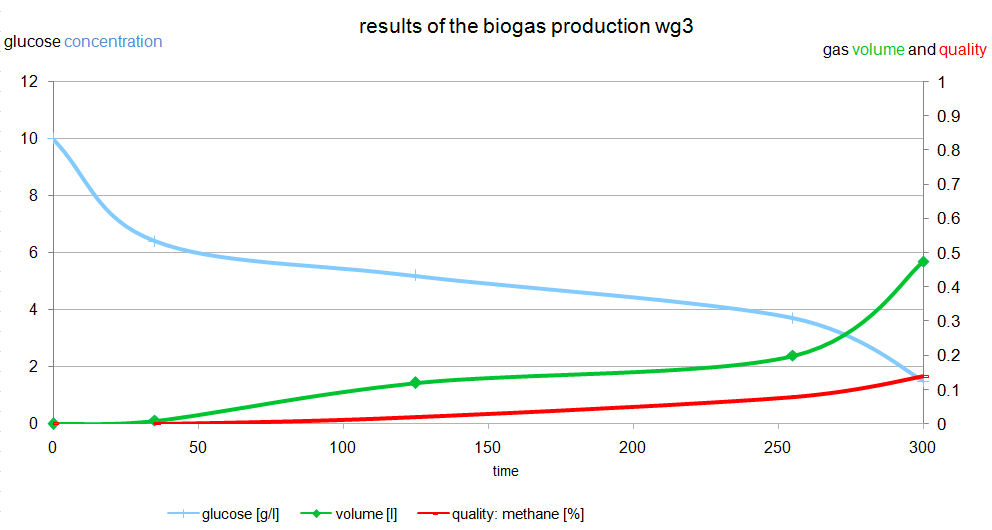
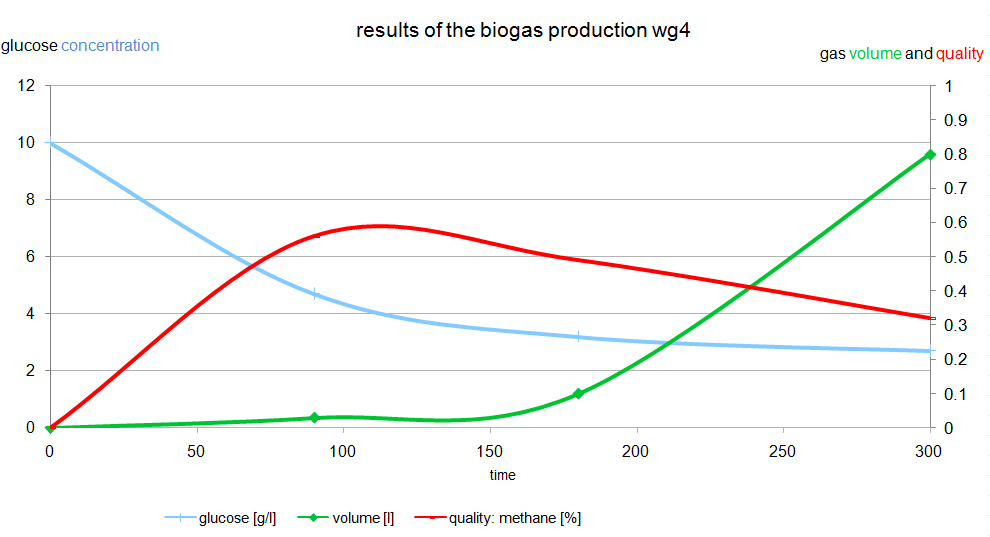
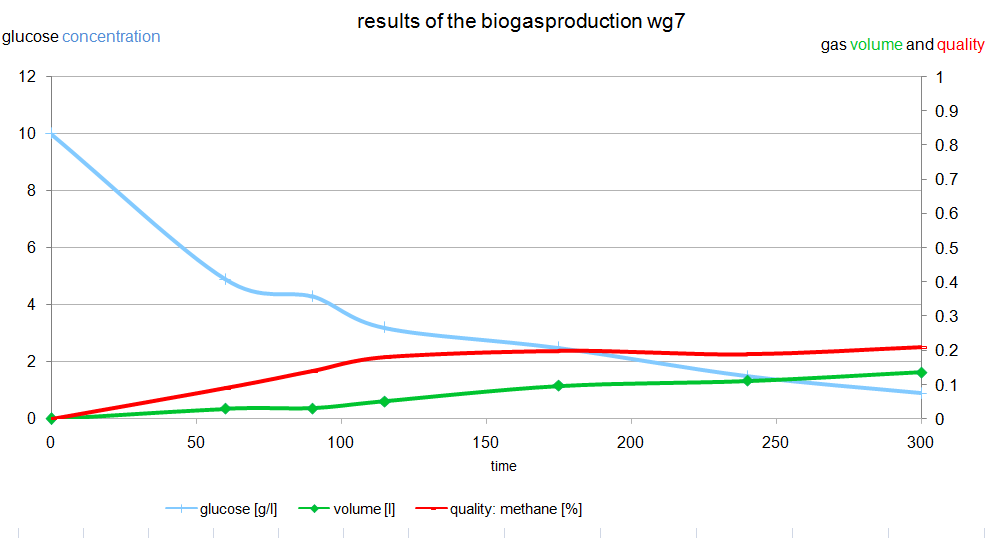
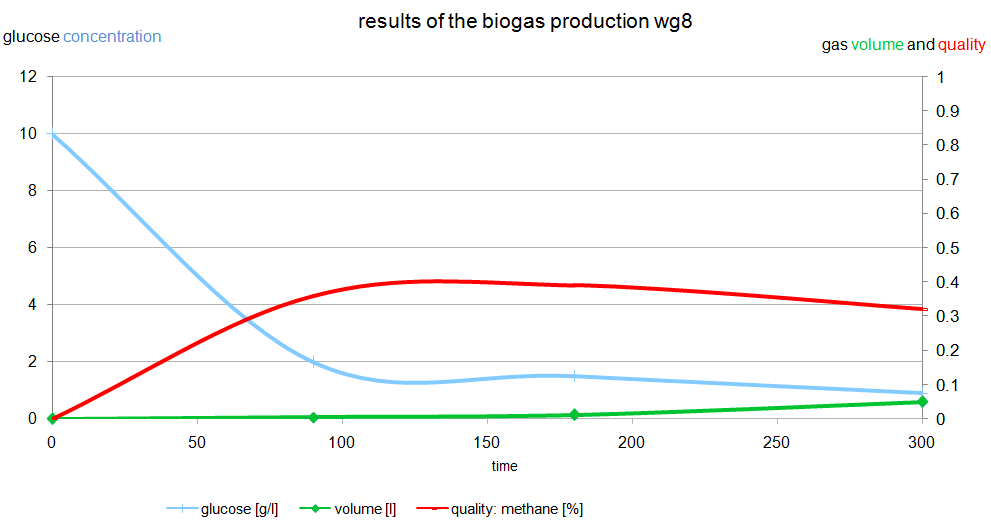
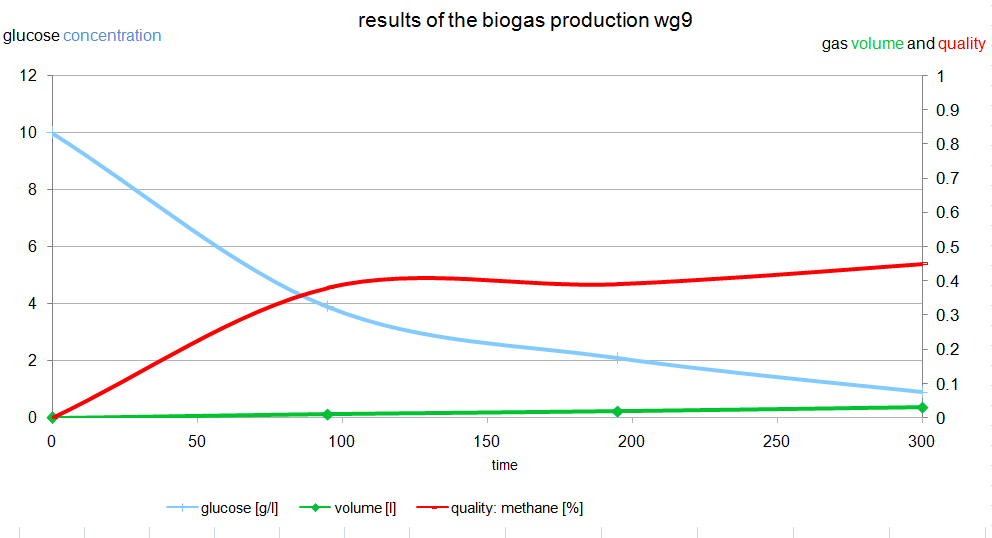
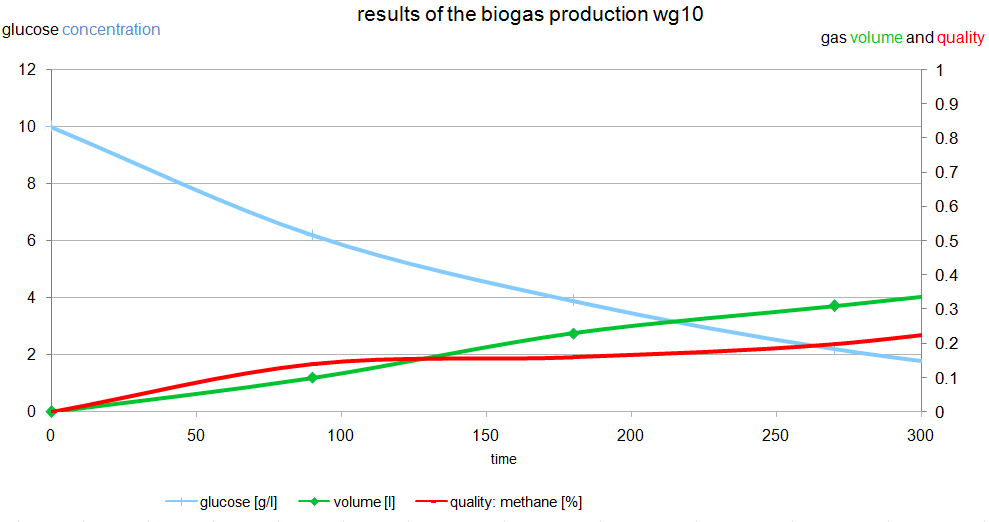
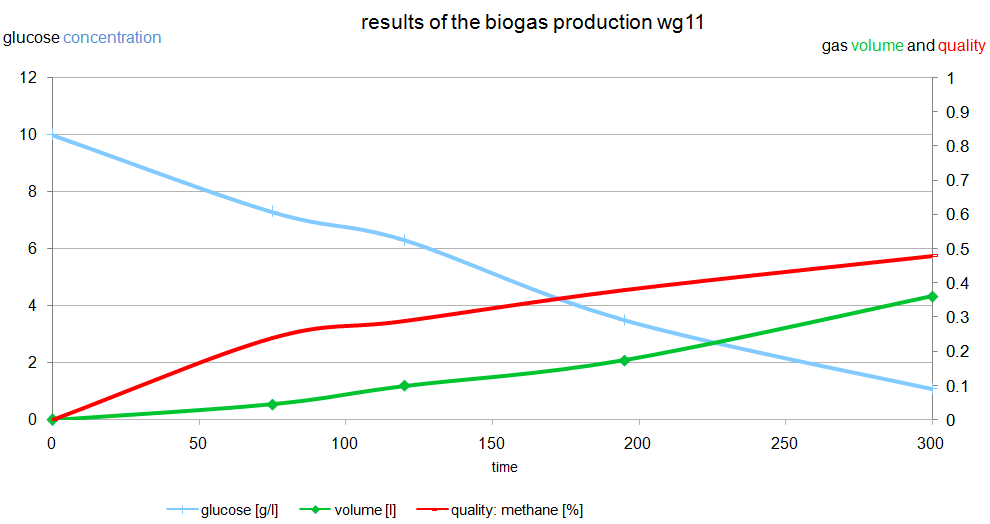
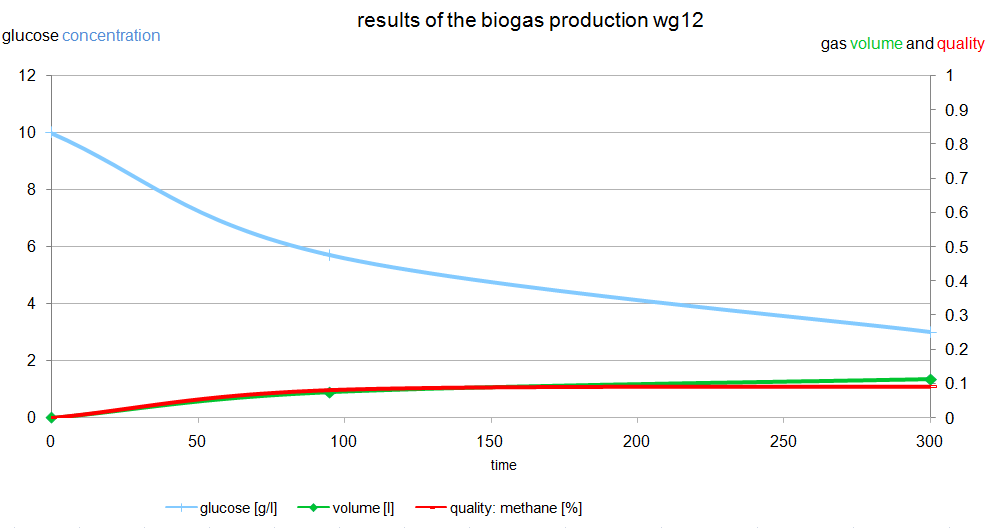
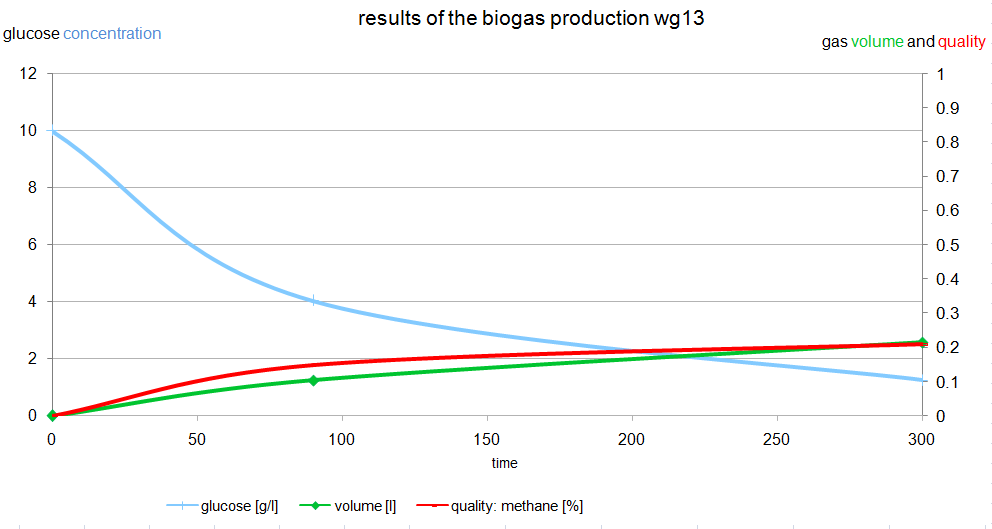
The results of the 14 workgroups are shown in the following diagrams:
.